Search by Category
- Marg Nano
- Swiggy & Zomato
- ABHA - Ayushman Bharat
- Marg Cloud
-
Masters
- Ledger Master
- Account Groups
- Inventory Master
- Rate and Discount Master
- Refresh Balances
- Cost Centre Master
- Opening Balances
- Master Statistics
- General Reminder
- Shortage Report
- Supplier Vs Company
- Temporary Limit
- Shop QRID and eBusiness
- Cloud Backup Setup
- Password and Powers
- Marg Licensing
- Marg Setup
- Target
- Budget
- Credit Limit Management
- Change ERP Edition
- Ease Of Gst Adoption
-
Transactions
- ERP To ERP Order
- Sale
- Purchase
- Sale Return
- Purchase Return
- Brk / Exp Receive
- Scrap Receive
- Brk / Exp Issue
- Scrap Issue
- GST Inward
- GST Outward
- Replacement Issue
- Replacement Receive
- Stock Issue
- Stock Receive
- Price Diff. Sale
- Price Diff. Purchase
- BOM
- Conversion
- Quotation
- Sale Order
- Purchase Order
- Dispatch Management
- ERP Bridger
- Transaction Import
- Download From Server
- Approvals
- Pendings
- Accounts
- Online Banking
-
Books
- Cash and Bank Book
- All Ledgers
- Entry Books
- Debtors Ledgers
- Creditors Ledger
- Purchase Register
- Sale Register
- Duties & Taxes
- Analytical Summaries
- Outstandings
- Collection Reports
- Depreciation
- T-Format Printing
- Multi Printing
- Bank Reconcilation
- Cheque Management
- Claims & Incentives
- Target Analysis
- Cost Centres
- Interest and Collection
- Final Reports
-
Stocks
- Current Stock
- Stock Analysis
- Filtered Stock
- Batch Stock
- Dump Stock
- Hold/Ban Stock
- Stock Valuation
- Minimum Level Stock
- Maximum Level Stock
- Expiry Stock
- Near Expiry Stock
- Stock Life Statement
- Batch Purchase Type
- Departments Reports
- Merge Report
- Stock Ageing Analysis
- Fast and Slow Moving Items
- Crate Reports
- Size Stock
-
Daily Reports
- Daily Working
- Fast SMS/E-Mail Reports
- Stock and Sale Analysis
- Order Calling
- Business on Google Map
- Sale Report
- Purchase Report
- Inventory Reports
- ABC Analysis
- All Accounting Reports
- Purchase Planning
- Dispatch Management Reports
- SQL Query Executor
- Transaction Analysis
- Claim Statement
- Upbhogkta Report
- Mandi Report
- Audit Trail
- Re-Order Management
- Reports
-
Reports Utilities
- Delete Special Deals
- Multi Deletion
- Multi Editing
- Merge Inventory Master
- Merge Accounts Master
- Edit Stock Balance
- Edit Outstanding
- Re-Posting
- Copy
- Batch Updation
- Structure/Junk Verificarion
- Data Import/Export
- Create History
- Voucher Numbering
- Group of Accounts
- Carry Balances
- Misc. Utilities
- Advance Utilities
- Shortcut Keys
- Exit
- Generals
- Backup
- Self Format
- GST Return
- Jewellery
- eBusiness
- Control Room
- Advance Features
- Registration
- Add On Features
- Queries
- Printing
- Networking
- Operators
- Garment
- Hot Keys
-
GST
- E-Invoicing
- Internal Audit
- Search GSTIN/PARTY
- Export Invoice Print
- Tax Clubbing
- Misc. GST Reports
- GST Self-Designed Reports
- GST Return Video
- GSTR Settings
- Auditors Details
- Update GST Patch
- Misc. GST Returns
- GST Register & Return
- GST RCM Statement
- GST Advance Statement
- GST Payment Statement
- Tax Registers and Summaries
- TDS/TCS Reports
- Form Iss./Receivable
- Mandi
- My QR Code
- E-Way Bill
- Marg pay
- Saloon Setup
- Restaurant
- Pharmanxt free Drugs
- Manufacturing
- Password and Power
- Digital Entry
Home > Margerp > Sale Report > How to Analyze sales growth ( Periodic Sales Growth ) in Marg Software ?
How to Analyze sales growth ( Periodic Sales Growth ) in Marg Software ?
Overview of Periodic Sales Growth in Marg ERP Software
Process of Periodic Sales Growth Option in Marg ERP Software
OVERVIEW OF PERIODIC SALES GROWTH IN MARG ERP SOFTWARE
- Periodic Sales Growth Option in Marg ERP Software facilitates the businessman to analyze the Sales growth by comparing it within the software.
- This provision enables the businessman to know the exact & proper sales growth of their business i.e. they can know & compare the progress of their previous three financial years based on Customer, Item, Company and Area, Category wise divide the top sales & can also analyze the financial performance of the business.
PROCESS OF PERIODIC SALES GROWTH OPTION IN MARG ERP SOFTWARE
- Go to Daily Reports >> Sale Report >> Periodic Sales Growth.
- Here, the user will see few options to view the Periodic sales growth i.e. Party wise, Salesman wise, Area wise, Company wise, etc.
- Suppose select ‘Party’.
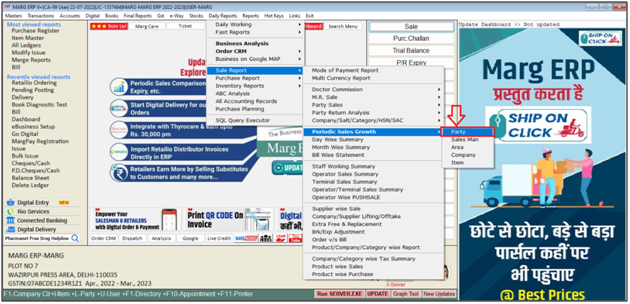
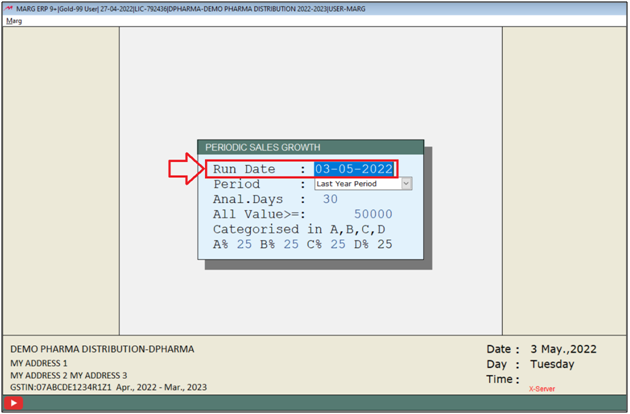
- A ‘Periodic Sales Growth’ window will appear.
- In ‘Run Date’ field, mention the date i.e. till which date the user needs to compare the Sales Growth.
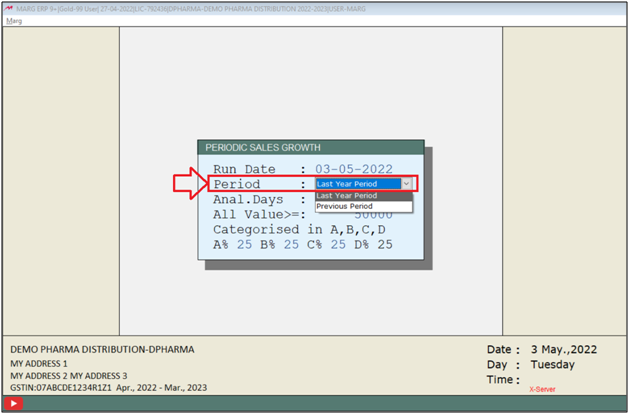
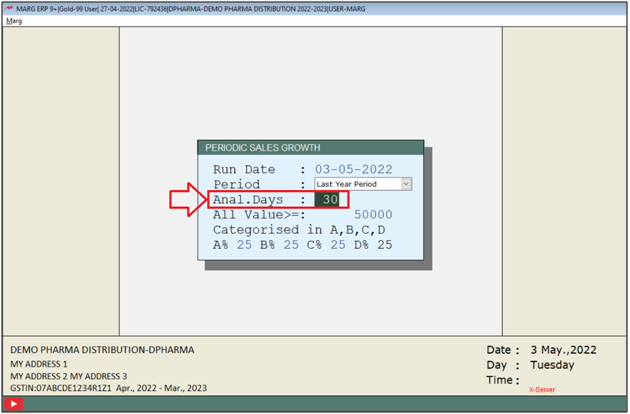
- In’ Period’ field, select the period like select ‘Last Year Period’ option. Then the sale of last 3 years will be shown year wise on the basis of analyze days.
- It means that the number of days the user will mention in analyze days like as if mentioned ‘30’, so on the basis of these 30 days, last 3 year sales will be shown.
- And if the user will select ‘Previous Period’ and mention 30 in analyze days then last 30 days, last to last 30 days, and 30 days before last to last 30 days i.e. the sale of last 3 months will be shown.
- And similarly, if the user will mention ‘60’ then last 60 days, last to last 60 days and 60 days before last to last month’s sale will be shown.
- In ‘Analyse Days’ field, mention that for how many days the user needs to compare the sales.
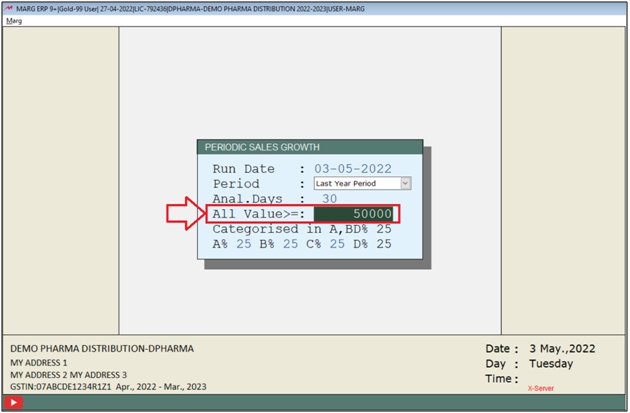
- ‘All Value >=’: It means that the report will be displayed of the sales which are above Rs. 50,000 and the user can also change this value as per the requirement.
- Now the user will set the category.
- Suppose the user needs to know that whose sales growth is higher in the last 3 financial years till the current date, i.e., the date which is mentioned here.
- Like if the sale of Rs. 5,00,000 is done and the user needs the top sale of 25% in 5,00,000 must be shown in ‘A’ category .
- Similarly, another top 25% sale must be shown in the ‘B’ category and also in ‘C’ and ‘D’ category must be shown.
- The user can also change these percentages as per the requirement.
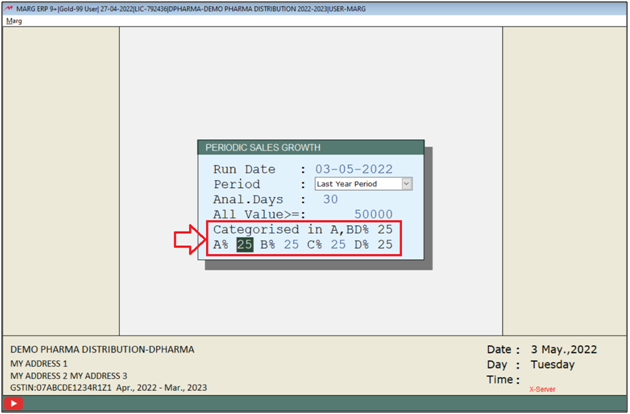
- Then press ‘Enter’.
- So, in this way the Periodic Sales Growth report will get generated.
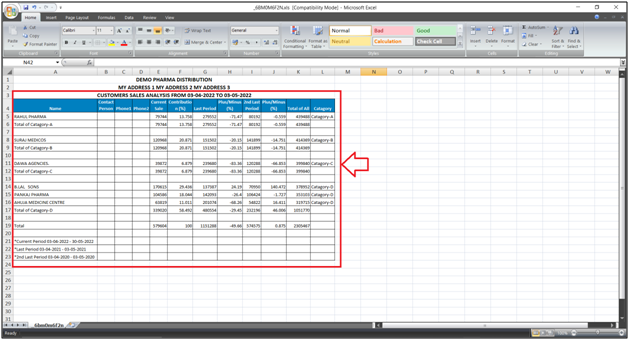
- The user can view the party wise current sale, contribution of each party during the current sale and the last period sales.
- Then the user can view plus/minus i.e. the difference between the sale which is done in the current period and in the last period is shown here.
- The user can view the sales of the 2nd last period, the plus/minus i.e. the difference between the sales which is done in the last period and in the 2nd last period is shown here.
- Then the user can view the ‘Total of All’.
- And can also view their categories according to the sales growth.
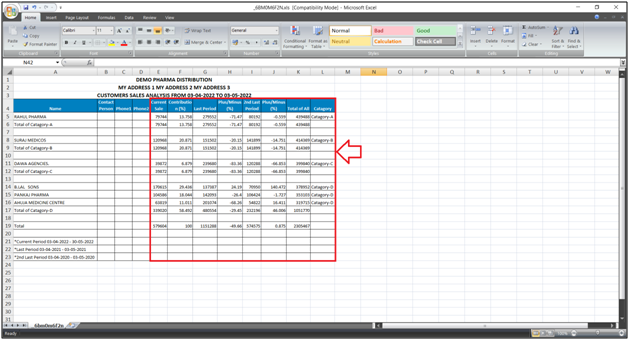
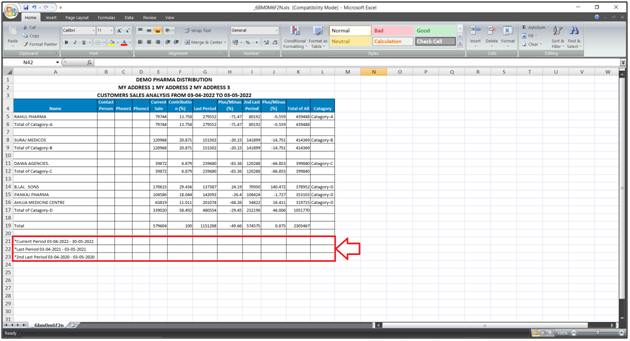
- Now the report has been generated on the basis of last year period and on the basis 30 days then on the basis of this, the user can view the current, last and 2nd last period.


 -
Marg ERP 9+


